
Forecasting Cash Flow for Your Business With Tiller

Forecasting cash flow is critical for businesses and almost no company does it well, if they even try.
Small to medium-sized businesses need it most, and purpose-specific software is tough to find, hard to use, and expensive. This was the reality for one of my clients before I created a solution using Tiller.
My client’s team was struggling to manage vendor payments, payroll, and credit card balances while also monitoring bank account balances and anticipating future receipts and payments.
I started the design process by asking some questions.
Why is managing cash flow so difficult?
The company is a direct-to-consumer retail brand that offers five customer payment channels which is important for the excellent customer experience (and revenue goals) of any online retailer.
Fortunately, all of the bank accounts and credit card accounts are held by one bank. Oh, except for Paypal. And Amazon. And… you get the idea.
Vendors are paid through the bill.com expense management platform, except when they’re paid by wire transfer, through vendor portals, and with credit cards.
There are so many moving parts in a wide variety of platforms and there’s no one place to view all the inputs and outputs for purposes of forecasting cash flow.
The workflow stack? Well, it’s complicated.
The company is growing, but cannot yet afford a robust solution like SAP that would eliminate the need for so many platforms (and perhaps introduce another set of headaches).
Can we pull the data together into one dashboard and find a way to keep it fresh?
Companies struggle to forecast beyond tomorrow. This certainly isn’t a new problem and, ironically, it isn’t made easier by having tons of platforms that are designed to make things easier.
It’s difficult to bring the data from each platform into one place to analyze and create a forecast. If the task is accomplished, guess what? The data is stale one, two, three days later. Startups have confronted this reality for decades using spreadsheets, which is fine, until the sheet is out of date.
My inspiration for a solution came from my family’s own finances in Tiller. I’ve used Tiller since 2015 for personal finances and for running my own consulting business, and forecasting cash flow is pretty simple.
My partner receives a paycheck, which is very predictable, and I can easily project my consulting income using the Tiller Community Projected Balances solution. I knew that Tiller would be an important part of the solution and it provided inspiration for the workflow design process.
My Solution
Here’s how the solution came together:
- I created a Tiller account for the company and connected the bank and credit card accounts.
- I added the Projected Balances solution to the Tiller Foundation sheet.
At first, I wasn’t as interested in Transactions as I was in Balances which gave me the current bank and credit card balances.
- Next, I needed to forecast cash inflows from the five payment channels.
Each channel auto-deposits payouts into one operating account, but not every day. For now, our financial system takes weekends and holidays off so, in addition to predicting payouts based on sales, I needed to consider the timing of when the payouts would land in the bank account.
To do this, I brought sales transactional data (tens of thousands of records per year) into the workflow using Data Connectors to tap BigQuery (fed from Shopify via Stitch) and defined the payout schedule for each channel so that I could forecast inflows.

- Forecasting Cash outflows required vendor payables data from bill.com and auto payments on six credit cards.
For making vendor payment decisions, I decided to keep it simple and build the workflow to accommodate a weekly copy/paste of the bill.com open payables report into the workflow matching the weekly cadence of vendor payments that the team had adopted.This can be done by anyone on the team with bill.com reporting-level access.
I added checkboxes to be used to show which open payables are proposed for payment each week and to facilitate the company’s approval process.

To make things a little easier, I used Apps Script to write some code that quickly erases the bill.com data that was pasted into the sheet and unchecks all the boxes to prepare for the vendor payment analysis process each week.
Then I added a quick glance analysis of credit card balances compared to the limits to facilitate fast payment decisions to keep workable limits on each card.

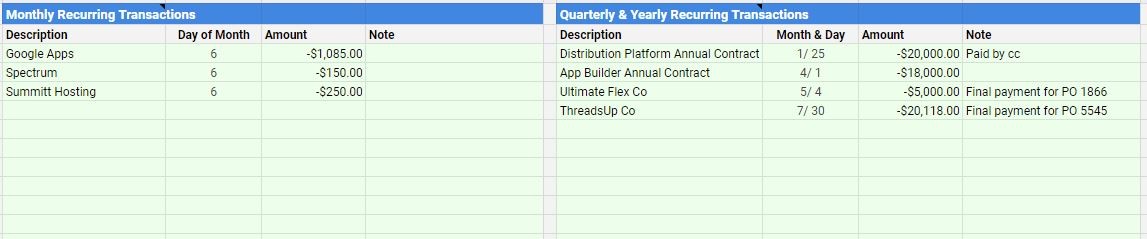
- Quarterly and Yearly payments for services needed to be included in the forecast to help eliminate being surprised by large payments coming due.
Tiller Community Solution Projected Balances addresses monthly and yearly payments, so it served as an inspiration for adding a way to capture quarterly data.
- I added a dashboard to chart projected cash balances and monitor cash burn rate.

- The final step was to release the workflow to the stakeholders for testing and feedback.
This is a super valuable step and here’s what I learned from my cohort:
- I controlled the Tiller account during the design phase, but ownership needed to pass to the teammate who manages Accounts Payable when the process was done. Tiller has a solution for switching accounts.
- Forecasting the timing for when payments will show up in Transactions can be tricky when you’re trying to anticipate the impact on your operating account balance.
For example, if you forecast that the annual general liability insurance payment will be deducted from your bank account on the 10th of the month, but the deduction is delayed until the 12th, the Projected Balances sheet assumes that the payment is made on the 10th and doesn’t adjust your projected balance accordingly. Managing these timing differences needs to be part of the analysis process and that required some training time with the team.
- Team members requested conditional formatting and visual cues to help them process the data and make decisions quickly.
A good example of this is the conditional formatting used to call attention to payments made via vendor portal as opposed to within the bill.com platform. In the past, duplicate payments had been issued as an oversight and the team wanted to avoid this mistake in the future.
The stakeholders will continue to provide feedback and request upgrades for this workflow and it will evolve over time.
Conclusion
The team is delighted that the workflow offers:
- a way to monitor all cash inflows and outflows to facilitate forecasting cash balances,
- quick visibility of credit card balances compared to credit limits, and
- improved coordination around vendor payment decisions and approvals.
The next steps include expanding the cash flow forecast to project cash flow further into the future. To do this, I will use historical data from the Transactions tab coupled with the seasonality of the industry to forecast future revenue inflows.
Many companies don’t even attempt to bring their financial data together in this way and address cash flow forecasting with manual efforts or not at all. Tiller provided a key ingredient to create this workflow and help this small business make spending decisions quickly and free time for other equally important tasks and challenges.
About Jennifer Billstrom

A natural leader who is happiest when surrounded by nature, I enjoy riding my bicycle, running, and hiking in the Blue Ridge Mountains and beyond.
When I’m not outdoors, I can be found at my desk creating visuals to tell stories based on data. I began my career as an accountant, first in public accounting, then focused on corporate consolidations before following the entrepreneurs path to creating the bicycle tour business, Velo Girl Rides. For more than eight years, creating tours and events tapped into my joy of managing projects and kept me grounded in my roots as a detail-oriented accountant.
Today my two worlds of cycling and data have blended together in an unexpected way. I am filled with gratitude that I get to work with the team at Kitsbow Cycling Apparel using all of the knowledge gained throughout my career along with new skills I continue to learn each day.


You must be logged in to post a comment.